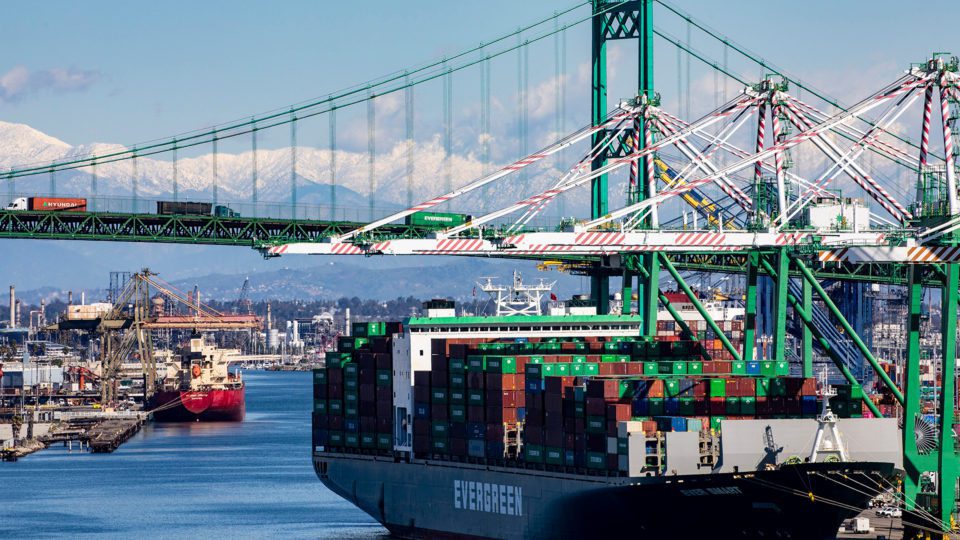
Sea-Intelligence CEO Alan Murphy maintains there is no global container shipping boom. As more capacity is currently deployed than ever before, the shortage must in turn be caused by poor utilisation of the deployed assets, specifically due to the unprecedented levels of congestion and the resulting vessel delays.
Although the analysis studies dry freight containers, tank container trade body ITCO said this partly explains the issues reported by ITCO tank operators over the shortage of timely space availability for tanks carried as SOC (shipper owned containers).
To investigate how much capacity vessel delays are effectively removing from the market, Sea-Intelligence followed a simple approach. As an example, a carrier offers a six-week roundtrip service with six x 10,000 TEU vessels. If vessels are then five days late on the head-haul and two days on the back-haul, it increases the round-trip to seven weeks, requiring one additional 10,000 TEU vessel to compensate for the delay-induced loss of capacity.
So to maintain the same weekly capacity, the carrier de-facto needs to increase nominal capacity by 16.7 percent. The effect of this is the same as if market demand had increased by 16.7 percent, as that would have required the same injection of net capacity in the market.
Using data from Sea-Intelligence’s Global Liner Performance (GLP) and Trade Capacity Outlook (TCO) databases, the analyst firm found that while 2-4 percent of capacity is usually ‘lost’ to vessels delays, approximately 25 percent of the capacity deployed on transpacific lane in January-April 2021 has been soaked up by vessel delays, far outpacing the 17 percent soaked up by the 2015 US West Coast labour dispute.
While Asia-Europe has seen less dramatic congestion and delays, a full 11 percent of the capacity deployed in the first four months of 2021 was soaked by vessel delays.
From a global perspective, at the height of the congestion in February 2021, almost 12 percent of global container capacity was absorbed by vessel delays and in April this was still at 8.6 percent. In nominal terms, this means that in February 2021, a full 2.8 million TEU of nominal vessel capacity was absorbed due to vessel delays, and in April 2021 this had only abated slightly to 2.1 million TEU.
For comparison, the entire global fleet of ultra-large container vessels (ULCVs) of 18,000 TEU and above has a combined capacity of some 2.7 million TEU. Hence, in very real terms, the congestion problems in 2021 is of such a magnitude, that the effect is the same as if the entire industry had decided to remove all ULCVs from the fleet, without adding any new vessels.
A follow-up analysis by Sea-Intelligence at the end of June found that carrier schedule reliability has been pretty poor in all of 2021 as several ports and regions have been severely impacted by port congestion.
Looking at the number of vessel arrivals subject to extreme delays, ie, more than seven calendar days, Asia to North America West Coast witnessed vessel arrivals of 7‑13 and 14‑20 days late at higher levels than at the height of the 2015 US West Coast labour dispute.
In January-May 2021, a “staggering” 695 vessel arrivals were over a week late, of which 343 arrivals were more than 14 days late, with 132 of the arrivals being more than 21 days late. For comparison, from January 2012 to December 2020, 1,535 vessel arrivals were more than a week late, 330 were more than two weeks late, and a combined 104 vessel arrivals were over 21 days late.
On Asia-North Europe, 461 arrivals were more than seven days late in January-May 2021, of which 134 were more than 14 days behind schedule, and 30 were more than 21 days late.
Port congestion is far from over, Sea-Intelligence said. In just May 2021, 174 vessels that berthed in North American ports on the transpacific trade were more than seven days late. On Asia-Europe, the number was 114, while on the transatlantic it was 169, 99 on Asia-Indian Subcontinent and 134 on Asia-Oceania.

